By: Chris Somers, A.C.E. and Service Manager at Rambo Total Pest Control
This article is part of a series on Rambo’s Remote Rodent Monitoring Program.
Part 1: Challenges and Opportunities
Part 2: Remote Sensing Technology
Part 3: Initial Results
Part 4: Norway Rat Test Sites
In this chapter we will begin to discuss specific accounts, bait formulations, and rodent stations. Data and graphs displaying activity have been collected using Bell Labs’ IQ line up of remote sensing technology.
Note: Codes have been assigned to keep client names and addresses confidential. Additionally, pictures and descriptions that could identify a location will not be used out of respect for our clients’ privacy.
We will primarily stick to accounts with Rattus norvegicus activity (Norway rat, aka Brown rat). We will focus on other species in future content.
When it came to sites with Norway rat activity, many showed early signs of activity. Nine out of the fifteen locations showed activity within the first two days. These early trends did not seem to be dictated by the amount of rodent pressure or levels of conducive conditions on site, such as food sources, water sources, harborage areas and safe travel paths. Indicating that the early exploration was not necessarily in response to competition for resources needed to survive.
Let’s discuss a very interesting account that is experiencing cohabitation on-site between a deer mouse population and Norway rat population.
For years, this account has been on a quarterly service frequency; this means that once every three months, we would perform a rodent control service. Over the years, we had consistently utilized second generation anticoagulant rodenticides (SGARs). The bait in the stations was completely consumed at almost every single service. Additionally, the population of rodents over the time period of September 2020 through February of 2021 had become much more disruptive to the clients.
On March 12th of 2021, we added them onto our newly-developed remote sensing program as test site KNP-5. The specific plan for this account would include switching to a monthly service frequency for the next 12 months and test out a first-generation anticoagulant rodenticide.
The difference with this method would be that we would look to adjust rodenticide and bait station quantities to the level of activity occurring on-site, which would require getting a detailed baseline on activity levels and maintaining a consistent bait supply—as opposed to the majority of our test accounts, which focus on delivering short application bursts of an acute rodenticide containing either bromethalin or cholecalciferol. The remote sensing stations would become a critical tool for analyzing this activity and determining bait quantity and application frequency.
As we began the program, we assessed the account’s history. Over the years, only deer mouse activity had been detected on site; there had been no evidence of Norway rat activity. While we were setting up the program, I helped assess where the previous equipment had been positioned. The lead tech and I agreed that the locations were solid choices. However, there was a fence line on the west side of the home that I noted as being a very likely area for rodents to traffic and shelter in.
The fence was wooden and aged. Ivy and other dense foliage covered the base and at some points went halfway up the fence. The fence was close to a detached structure with a raised base that allowed about six to eight inches of clearance under it. A large decaying tree stump and stored items were also in close proximity to this fence line. If you followed the fence line closer to the house, the dense low foliage would lead to a cluster of trees. The neighbors on the opposite side of the fence had a garden.
The account had three stations on site. Due to this conducive area, we decided to add a fourth station to be positioned along the West fence line, and one of the existing stations on the west side of the house was repositioned to account for this new treatment area. Non-toxic monitoring bait was placed in each station to begin the process of obtaining baselines on activity levels.
We had our first follow-up at KNP-5 on 4/22/2021. The graph below displays the stations with activity, the dates that activity took place, as well as the number of times a station was entered on each day.
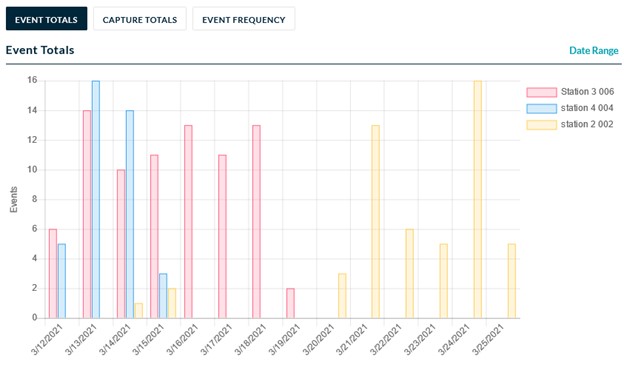
As you can see on the graph, Station 3 and 4 began experiencing rodent activity on the actual day of deployment. When looking over the reports, we noted that the first incursion into Station 3 was detected at 7:15pm. The next incursion was detected in Station 4 at 7:20pm that night. At that time of the year, the 7:00pm to 8:00pm time range is dusk. At the time of the follow-up, both Stations 3 and 4 contained heavy evidence of Norway rat evidence: fur, an accumulation of droppings, and the measurement of incisors from rodent gnawing. No deer mouse activity was noted in those stations.
Station 2, on the east side of the structure, which was opposite to Stations 3 and 4 began detecting events on 3/14/2021. Station 2 continued to only show deer mouse activity.
Now as I mentioned earlier, this account had always shown deer mouse activity; we had years on-site detecting nothing but deer mice. I had also mentioned that an account’s amount of rodent pressure and level of conducive conditions didn’t seem to have a substantial impact on the early feeding patterns being observed by the Norway rat populations at many accounts. Station location, on the other hand, may have been the common theme to look at in regard to the timelines on acceptance.
To explore this further, we can look at other accounts: different locations with different populations displaying their own site-specific behaviors.
Site HDM-1 has a high pressure Norway rat population. They have a primary residence, a shed as an outbuilding, and a chicken coop. They were also an existing customer on a quarterly service frequency that had utilized SGARs on site for years—again with complete consumption on a consistent basis.
On 3/12/2021 we added site HDM-1 as an acute rodenticide testing site. As such, we would start off with a non-toxic bait, and monitor the feeding levels to establish a baseline on activity. Then, would start performing pulse baiting applications: a quick burst of rodenticide, and then a switch back to a non-toxic bait to monitor the impacts and establish new baselines.
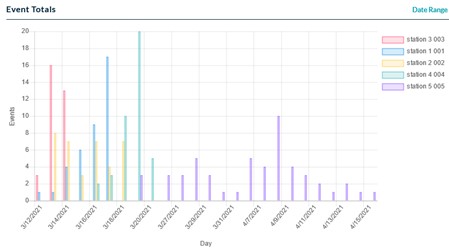
This graph displays the events that took place between the account setup on March 12th and the first follow-up on April 15th. As you can see, the activity at this location started on day one. First detection was at 8:00pm that night in Stations 1 and 3. All five stations had been explored by the eighth day. Stations 1, 2, and 3 were the first stations to get hit.
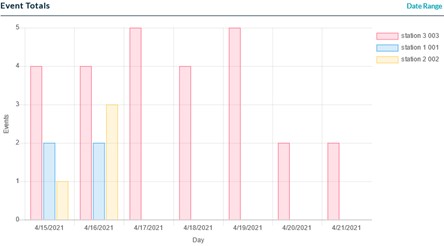
Now, if we fast forward and look at the next time frame of April 15th through April 21st, you can see that those three stations were the only ones with activity. Station 3 was under a deck—a protected harborage area with low levels of light. Station 2 was on the side of the shed near the chicken coop, and also had low exposure to light. Station 1 had high levels of dense foliage within 10 feet of it—which blocked the porch light from the neighboring home—but the station itself was not placed within that foliage since the property line was not clearly defined.
The other thing to note is that Station 1 was on the north side of the house, which not only had dense foliage nearby, but had a sloping hill that prevented people from using it as a travel path safely. We commonly walk around difficult terrain, but even I would say that area is a pretty dicey area to climb around. So other than us, it was generally an undisturbed area.
Station 4 was located near a walkway on the south side of the home and Station 5 was positioned on the exterior of the chicken coop. The station by the chicken coop likely had light from the back porch that would shine towards it. It was also located right next to a primary competing food source. The station along the walkway likely saw more foot traffic, and was exposed to low levels of light from the neighbors property.
Although in the long run this account would have activity in all stations regularly, we can view a longer stretch of activity at this location and still see some common preferences in the stations. For example, the graph below shows the incursions into each station between the dates of June 19th of 2021 and July 15th of 2021. Out of the 137 events recorded, 111 of them occurred in Stations 1, 2, and 3, leaving just 26 events in the two less-visited stations.
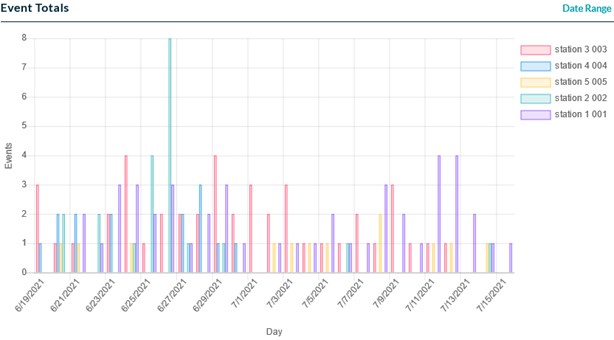
Some good takeaways. At site HDM-1, station placement and the surroundings of each rodent station likely played the most critical role in effectiveness. We utilized four different forms of bait at site HDM-1 between 3/12/2021 and 7/15/2021. The forms of bait, active ingredients, and brands did not seem to have any substantial impact when it came to station preferences.
At site KNP-5, a simple alteration to the station placement revealed a population of rodents that had otherwise gone undetected, potentially for years. Reinforcing the fact that where you choose to put your equipment really matters. Having the data at multiple accounts to showcase just how true this is was impressive and extremely valuable.
Rats are considered cryptic and extremely cautious in their risk assessments. If your species evolved as a prey animal, you’d probably be assessing risk at every turn as well, especially if the success of your species also depended on your ability to extract resources provided by an animal that hunted you. That is the relationship between humans and commensal rodents such as the Norway rat. Although they are secretive, they leave clues behind. They have behaviors and common tendencies that we can understand.
Like with anything, you will have people that are more in tune with a specific process. Rodent control is a technical process requiring keen observation and the ability to both analyze your findings and develop effective plans. Some technicians will be more effective at this than others. Knowledge and dedication will enhance these abilities. But we must also be willing to take the time and energy to implement this knowledge effectively on a daily basis. Hopefully this content will showcase how effectively approaching inspections and equipment placement can be the difference between finding and controlling a rodent population, or never even knowing it was there.
In the next post, we’ll take a look at some initial findings at accounts with Roof rat (Rattus rattus) activity—a species commonly thought to be even more secretive than Norway rats.
