By: Chris Somers, A.C.E. and Service Manager at Rambo Total Pest Control
This article is part of a series on Rambo’s Remote Rodent Monitoring Program.
Remote sensing technology has allowed us to collect a massive amount of data from a number of our accounts. Some of the results were anticipated—others were quite surprising! In this chapter, we will primarily review the dispersal of accounts on the program, as well as touch on some of the initial results and how they were obtained.
Rodent Species and Activity in Program Accounts
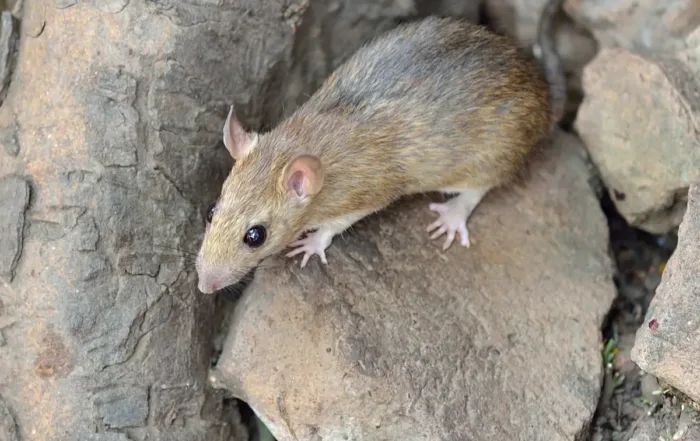
We set up the remote sensing accounts to be fairly diverse. We had accounts with one specific species of rodent, and others where two or three species were cohabitating. Rattus norvegicus (Norway rat) and Peromyscus maniculatus (Deer mouse) had the highest representation, while Rattus rattus (Roof rat) came in a close third place. Mus musculus (House mouse) activity was only represented at one location that fell under cohabitating circumstances.
Out of these four species of rodent, the number of house mouse situations our company encounters is significantly less than any of the other three species. Therefore, their representation in this program naturally reflected that. See the figure below for a breakdown on the active rodents at accounts under this program.
With the accounts on this program, we also had the level of pressure at each location to consider. We looked at the rodent species and assigned it to one of the following categories:
- Low pressure, which would be defined by 0 to 25 rodent incursions within a 30-day period
- Moderate pressure, being defined by 26 to 100 incursions within a 30-day period
- High pressure, defined by over 100 rodent incursions detected within a 30 day period
The amount of pressure at each account was based on the level of activity per species (on average). If an account had multiple rodent species on site, it would have more than one level of pressure documented; this way, we could measure the success of treatments performed for each species on site. This is very useful information should one of the species have higher or lower population drops in response to a specific treatment or piece of equipment.
Over the first couple months, there was a decent amount of fluctuation on where accounts would land within these categories. Since it took a while for the activity to become consistent enough to properly gauge, the initial numbers could be fairly misleading. However, the picture became much clearer by the time we got into the fourth month of servicing the accounts. For this reason, I’ll begin with the rodent population identification statistics based off of what we know to be accurate as of June 1st, 2021.
| Pressure | Mus Musculus | Peromyscus Maniculatus | Rattus Rattus | Rattus Norvegicus | Multispecies Co-habitation |
|---|---|---|---|---|---|
| High | 0 | 5 | 2 | 4 | 3 |
| Moderate | 1 | 3 | 4 | 7 | 5 |
| Low | 0 | 1 | 0 | 4 | 0 |
| Total accounts with listed species | 1 | 9 | 6 | 15 | 8 |
| Statistics listed here were accurate as of June 1st, 2021 | |||||
Goals & Results
The goal is to decrease the level of high and moderate pressure accounts to low levels over the duration of this program. And, as we continue to reduce the rodent pressure at accounts, we maintain that progress by using either less or no rodenticide on site.
There is always a possibility of the rodent pressure escalating for a variety of reasons. The purpose of this series of posts is to report on things accurately and cover successful events as well as less-than-ideal outcomes. As part of this series, we will also attempt to identify why the outcome (whether positive or negative) has occurred while updating the chart seen above accordingly.
Over the first three-month period of the program, (March 2021 through May 2021) it appeared that in the majority of cases:
- Norway rats and roof rats showed a fairly high level of feeding and population knockdown at locations
- House mouse activity was stomped out much sooner than any other species listed
- Deer mouse populations showed high levels of activity, but on average there was very little knockdown being observed in recorded events
At the majority of accounts with Norway rat activity, bait station exploration started almost immediately, often within three days of equipment deployment. In some cases, the exploration of stations began the same day as equipment was placed.
Roof rat activity, although slower overall, sometimes began within the first few days of the equipment being placed. For example, site SP-1 had equipment installed on 3/12/2021. This was an initial service, so the bait stations were not only new equipment, they were brand new objects to the environment. Due to their neophobic tendency (which means a fear of new things), when new objects are added to the environment, we do not expect to see feeding activity begin for the first few weeks. Rats often approach new objects in their environment cautiously; despite this, the incursions began within the first few days. See the figure below:
Station 1 was located between foliage used for harborage and a food source (chicken coop). Exploration began to occur two days after it was placed—twelve incursions within eight days. No feeding had occurred, but droppings were located in the station, confirming roof rats had been present. We will discuss this further in upcoming posts.
Bait Strategies for the Remote Sensing Program
As part of this program, we start out with non-toxic monitoring bait. Thus, the feeding that had occurred in Station 1 did not contain anything to control the rodents. But now that feeding was occurring, we switched the bait in Station 1 from a non-toxic bait to a rodenticide that had an active ingredient capable of a knockdown. After a successful baiting application and reduction in recorded events, the station(s) would transition back to non-toxic monitoring bait formulations.
By doing the tests in this way, we could monitor the acceptance of different formulations. We could also start monitoring the impact that an application had against the target species.
This same process was occurring at 24 other locations. Different baits and styles of rodent stations were being utilized. In the next post we will take a deeper dive into specific accounts, their rodent populations, the baits/rodenticides used, and the variety of equipment being utilized at locations.
As stated at the beginning of this post, we have been able to collect a considerable amount of data regarding rodent activity. And as you will soon see, we’ve barely scratched the surface of both what has been found and what there is left to explore. Look for chapter four, which will be coming very soon.


